Faltering New Build Sales Add Pressure to Resale Market

Recent research by Warwick estates has found that over the last decade New Build Sales have fallen significantly. In 2011 there were 68,677 sales, but by 2021 that number dropped to 41,634. This represents a fall of 39% at a time when government promised additional new housing stock and the availability of resale properties also fell significantly. _dsc3981-hdr-copy

New build sales also fell year-on-year by -46%, as there were 76,764 in 2020. Whilst this could be attributed to some extent to lockdown and Covid, the development sector was in large part exempt from the lockdown rules so the figures are still nonetheless very disappointing.

With falling stock levels of new build properties, buyers are being forced in turn to look at the resale property sector instead. This at the same time as availability of resale properties is at a critically low level, demand outstripping supply significantly.

What does all of this mean for the typical homeowner or the typical buyer? Likely a continued upward pressure on prices, despite the underlying economic conditions and increases in interest rates.

A potential buyer asked me the other day “Do you think house prices will fall back again soon?” With demand massively outflanking supply my straight, honest answer was “No. not any time soon.” Only a fall in the availability of finance would apply the brakes at the moment and there is no sign at present of this happening, despite the interest rate rises.

If you would like a professional opinion on the current value of your own home, speak to one of our experts. We’d be delighted to help.

Coventry’s ‘Generation Stuck’ and Their £7,764m Tied-up Equity


Copy of 403 SquareThe predicament of the Coventry 20 to 30 year olds who rent and their inability to get onto the housing ladder is often discussed in the press.

There are 4.43m properties in the UK that are still in the private rented sector (compared to 2.13m in 2002).

This group of people in their 20s and 30’s, who rent from a private landlord, are often called ‘Generation Rent’.

Yet would it surprise you that since 2017, the number of UK households in the private rented sector has reduced by 260,000 whilst the number of homeowners has increased by 1.1m?

In this article I want to talk about another set of people,

not ‘Generation Rent’, but ‘Generation Stuck’.

Generation Stuck are our middle-aged and mature homeowners of Coventry. They are the generation that could be described as late ‘Baby Boomers’ (born in late 1950s and early 1960s) and the early ‘Gen X’ (born in the mid 1960s to early 1970s).

These 50 to 64 year old Coventry people feel stuck in their homes, and therefore I have nicknamed them ‘Generation Stuck’. Their inability to move could be holding back those younger Coventry ‘Generation Renters’.

So, let me look at the numbers involved.

In Coventry, there are 18,517 households, whose owners are aged between 50 and 64 years old and are about to pay their mortgage off on property that is worth £3,660.63m.

There are an additional 20,757 mortgage free Coventry households, owned by 50 to 64 year olds, worth £4,1033.45m, meaning …

Coventry ‘Baby Boomers’ and Coventry ‘Gen X ‘are sitting on £7,764.1m worth of Coventry property.

According to the Census, 47.8% of homes occupied by 50 to 64 year olds have two or more spare bedrooms.

This is backed up by the annual English Housing Survey that states nationally, 49% of properties occupied by these ‘Generation Stuck’ are ‘under-occupied’.

Under-occupied is categorised as having at least two spare bedrooms.

Looking at the statistics closer to home …

41.2% of Coventry 50 to 64 year olds have two or more spare bedrooms, making it the 277th highest local authority in the country

(out of 348 local authorities).

The rising number of older Coventry homeowners who want to downsize their Coventry home are often held back by the lack of suitable housing options for older people and the difficulties of moving.

Lots of over 50 year old Coventry people cannot move home in the way that they would like, due to a lack of suitable housing options and so can find themselves ‘stuck’ in homes which are no longer suitable for them as they age.

Only 1 in 29 people over the age of 50 move home each year compared to 1 in 15 for the rest of the population.

Helping mature Coventry homeowners (Generation Stuck) to downsize their homes at the right time will also allow younger Coventry people (Generation Rent) to find the Coventry family homes they need – meaning every generation wins, both young and old.

However, to ensure downsizing works, we need more choices for these “last-time-buyers”.

That means building more bungalows or more ground floor apartments suitable for the middle to older generation.

One way this could be done is by changing the planning rules to force builders to build these types of properties, whilst the other could be the changing of the stamp duty tax breaks for downsizers.

In this way, older Coventry people will be more able to move into homes which suit their specific needs, improve their quality of life whilst meeting their goals in life, all without them becoming detached from their friends and family locally in the Coventry area.

These are my thoughts, please let me know yours.

Coventry Property Prices Have Risen by 406% Since 1995

Coventry Property Prices Have Risen by 406% Since 1995
Property Rises by 406%

“Tell me what is happening to the Coventry property market”, asked the friend of a friend at a recent do I went to in Coventry (after finding out I was an agent in Coventry).

I always reply, “It depends if you are buying, selling or both”.

The Coventry property market is like a seesaw. For the last two years, it has been quite firmly in the realms of a 90% seller’s/10% buyer’s market.

However, unless you are a Coventry buy-to-let landlord, Coventry first-time buyer, or executors selling a deceased person’s estate, most home movers are both (i.e. they are both sellers and buyers).

So, what determines where we are on the seesaw of a seller’s market or a buyer’s market?

It comes down to simple supply and demand economics. i.e. the number of properties on the market versus the number of buyers in the market.

Like when someone sells goods or services, it’s the same with property. So, when we have a low supply of properties on the market and high demand for properties to move into (like we have had for the last two years since the end of lockdown one), house prices go up.

Coventry house prices are 8.6% higher than a year ago.

The other side of the coin was seen in the Credit Crunch years of 2008/9. Many people wanted to sell their houses in Coventry, yet the banks weren’t lending, so people couldn’t buy. This meant the supply of property on the market exceeded demand; hence Coventry house prices dropped by 16% to 19% in 18 months (depending on what type of property you were selling) as we had a 20% seller’s market / 80% buyer’s market.

Whilst demand and supply are the key driving force on the balance of the buyer/seller’s market seesaw, it is not the only influencer of the property market. The price band is also an essential determiner of house prices, albeit over the longer term.

To show this, initially, I will go back to 1995 to ascertain what has happened to average house prices over the long term in Coventry.

The average Coventry house price has risen from £45,141 in 1995 to £228,420 in 2021, a growth of 406%.

Interesting, when you compare that against the national figure of 407.2%. Also, looking at where our local authority stands against other areas, we are 159th out of 331 local authorities in England & Wales for house price growth.

It’s called the property ladder for an excellent reason, and the health of the whole Coventry property market is very dependent on those bottom rungs of that ladder.

Therefore, looking at the data for our local authority, paying particular attention to the lower end (in terms of price), some intriguing data comes to light. It is crucial as the lower end of the property market (in terms of price) is a good bellwether for the whole Coventry property market.

So, I looked at the following …

  1. Lower 10th Percentile of the Coventry housing market – i.e., the bottom 10% in terms of the value of properties sold – e.g., small apartments and ex-local authority properties in the less popular areas, which mainly attract buy-to-let landlords.
  1. Lower Quartile of the Coventry housing market – i.e., the bottom 25% of Coventry property in terms of their value, e.g., first-time buyer homes and mid-market buy-to-let property.

… and if one looks at our figures for Coventry and the whole local authority, you can see the three parts (lowest 10% / lowest 25% and overall average) have performed quite differently.

  • The average value of a Coventry property sold in 1995 in the lower 10th percentile (i.e., the bottom 10% of the Coventry property market) was £23,000, and in 2021, it was £130,000, a growth of 465.2% (compared to the national average of 428.4%).
  • The average value of a Coventry property sold in 1995 in the lower quartile (i.e., the bottom 25% of the Coventry property market) was £31,000, and in 2021, it was £162,000, a growth of 422.6% (compared to the national average of 417.7%).

Some of you might be asking yourself, what do all these different figures mean to Coventry homeowners, first-time buyers and landlords?

As the overall average is below the lower 10th percentile and lower quartile growth figures, the middle to upper market in Coventry has performed worse than the lower end in terms of house price growth since 1995.

The thought I am trying to get across to every Coventry homeowner/buy-to-let landlord is that there isn’t just ‘one’ Coventry property market.

There are markets within markets – almost like a fly’s eye. It is essential not to look at just the headlines but delve deeper when considering what is really happening and not to just look at the overall averages.

As we enter the height of the summer, the Coventry property market seesaw has started to change ever so slightly, changing from the 90% seller’s/10% buyer’s market we have had in the last two years to more of a 70% seller’s/30% buyer’s market.

With that in mind, if you can spot trends before anyone else is aware of them you could find yourself some potential Coventry property bargains.

76.8% of Coventry Properties Were Bought With a Mortgage in the Last Ten Years

76.8% Mortgage

Could the high levels of mortgages that Coventry people take out cause another property crash?

Many Coventry homeowners and landlords have been contacting me recently and asking what will happen to the Coventry (and the UK) property market? More specifically, will we have a repeat of the 2008/9 Credit Crunch property crash?

High mortgage payments were one of the critical catalysts to Coventry house prices dropping by between 16% and 19% (depending on the type of property) in just over one year in Coventry.

To answer that question, let me look at the mortgage numbers locally to see where we stand in the Coventry area.

2,674 of the 42,569 property sales in the last decade in Coventry were made with a mortgage

76.8% of our local authority area house purchases have been made with a mortgage (meaning 23.2% are made with 100% cash).

Interesting, when compared with the national average of 67.4% of house purchases with a mortgage over the last decade.

However, what is thought-provoking is the number of house purchasers buying with a mortgage has steadily been increasing over the last decade.

Between 2012 and 2017, the percentage of people buying with a mortgage was 74.9%, yet over the last five years in Coventry, that has risen to 80.3%

 Initially, this doesn’t sound good. Yet, as always with my articles on the Coventry property market, the devil is in the detail.

The issue is that most people need a mortgage to buy their home.

However, it’s not the amount of mortgage that is the issue, more the level of monthly payments. So, if you fix your mortgage rate, then your payments are fixed (a good idea especially as interest rates are on the rise).

In the last quarter, just under nineteen out of twenty (94.35%) of new borrowers that took out a mortgage had a fixed-rate mortgage at an average interest rate of 1.84%

That’s good news for recent buyers as most of their payments won’t rise even though Bank of England interest rates have risen over the last few months. Yet it’s essential to see what existing homeowners with mortgages have done with their mortgage rates (i.e. fixed or not) as they form the bulk of the property market.

This is because in 2008/9 (the last crash), many people were unable to afford their high monthly mortgage payments when they were made redundant because interest rates were much higher. This meant many Coventry homeowners ‘dumped’ their houses onto the market, all in one go in 2008, because they couldn’t afford their high mortgage payments.

Also, the banks could not lend money for mortgages as easily because of the Credit Crunch, meaning fewer people could get a mortgage, so the demand for Coventry houses dropped as well.

In a nutshell, the number of Coventry properties on the market almost doubled overnight in 2008, yet demand plummeted as mortgages were hard to come by. High supply and low demand meant Coventry house prices nosedived in 2008/9

Going into the Credit Crunch, one in six (60.4%) homeowners with a mortgage had a fixed rate at an average rate of 5.76%. By 2013, this had dropped to one in three people (33.29%) having a fixed-rate mortgage at an average of 3.34%.

Yet today, just under 17 out of 20 homeowners with a mortgage have a fixed rate at an average of 1.97%

Whilst the country might owe collectively £1,630.5 billion in mortgages, irrespective of increasing rates, most homeowners have protected themselves with a low fixed interest rate.

Also, the overall ratio of mortgage debt in the UK, compared to the value of the homes the mortgages are lent on, is also low compared to the year before the last property crash. This ratio is called the Loan to Value ratio (LTV). The higher the LTV, the less equity the homeowner has in the property.

In 2007 (the year before the crash), only 49.4% of people had a mortgage less than 75% of the house’s value (i.e. they had an LTV of less than 75%). Today that stands at 60.9%, which means more people have more equity in their property.

Another thought on why the country is in a better position is only 4.22% of mortgages have a 90% or higher LTV (compared to 16.28% just before the crash in 2007).

1 in 6 people were vulnerable to negative equity in the last property crash, whilst today that would only be 1 in 25.

This means if we do have another property market correction for any other reason … the number of people in negative equity will be much smaller, so it won’t affect the property market as much.

So, in conclusion, as we have fewer people with high LTV mortgages and fixed rates that are a third of what they were in the Credit Crunch, we are, as a country, in a better position to weather any storm.

If you would like any advice or opinion on the Coventry property market, be it buying or selling or anything to do with investing in the Coventry buy-to-let property market, don’t hesitate to drop me a line.

27.3% of Coventry Property Sellers Reduce Their Asking Prices as the Property Market Starts to Return to Equilibrium

27.3% of Coventry Property Sellers Reduce Their Asking Prices as the Property Market Starts to Return to Equilibrium


  • 419 of the 1,536 properties on the market in the Coventry area have had a price reduction in the last 3 months.
  • The average reduction has been 5.6% of the original asking price.
  • This is great news for Coventry home buyers and Coventry buy-to-let landlords, strangely Coventry house sellers as well.

The last couple of years of the Coventry property market has seen some amazing prices being achieved with multiple offers and many properties selling for way over the asking price.

Yet, as I have been writing about the Coventry property market over the last few weeks, the tide is beginning to turn, and the pendulum swing more towards a balanced Coventry property market as more homeowners in the Coventry area (CV1 – CV7) have been reducing their asking prices.

Of the 1,536 properties for sale in the Coventry area,

419 have been reduced in price in the last 3 months.

This can be broken down as follows…

Price Range of the Coventry Property Number of Price Reductions in Last 3 Months
£0-£50k 1
£50k-£100k 13
£100k-£150k 46
£150k-£200k 61
£200k-£250k 72
£250k-£300k 76
£300k-£350k 44
£350k-£400k 38
£400k-£500k 32
£500k-£600k 13
£600k-£750k 12
£750k-£1m 6
£1m-£2m 5


So why is this important and why is this good news, even for Coventry house sellers?

Property industry statistics show that 5 out of 6 house sellers will buy another property and over 80% of those sellers will move up the property ladder.

When you move up the property ladder, that normally means you pay more for the one you want to move to (that’s why it’s called the property ladder).

So, whilst you won’t be getting as much for yours as you might have done earlier in the year, you won’t have to pay as much for the one you want to buy (and the price difference between the two properties will be smaller – meaning you will end up saving money because of these reductions).

Therefore, what is the level of reduction being seen in the Coventry property market?

The average percentage of the price reduction in the

Coventry area has been 5.6%.

I must stress house prices/values in Coventry haven’t dropped 5.6%, just the asking prices of some of the properties on the market.

This is good news for Coventry first-time buyers and landlords, as they will be more likely to buy a property at a more reasonable price. Whilst, as I explained above, this is also good news for sellers as most of them will end up paying less for the higher priced property they end up buying after selling theirs.

So, what should Coventry homeowners be aware of if they are selling their home now or in the future?

For me, it is important that I inform all Coventry property owners of the real story. This enables them to judge for themselves where they stand in the current Coventry property market, thus enabling them to make better informed decisions.

You see some Coventry estate agents will deliberately over inflate the suggested initial asking price to the house seller, because it gives them a bigger chance to secure the property on that agent’s book, as opposed to a competitor.

This practice is called overvaluing.

Now of course, each Coventry homeowner wants to get the most for their Coventry home, yet some estate agents know this and prey on those Coventry house sellers.

You might ask, what is the problem with that?

Well, you only get one opportunity at hitting the Coventry property market as a new property. Everybody has access to the internet, social media and the four main property portals (Rightmove, Boomin, On The Market, Zoopla), and your potential buyers will know the property market like the back of their hand.

If you have a 2-bed Coventry semi that is on the market for a 3-bed Coventry semi-detached house price … those Coventry buyers will ignore you.

Your Coventry property will stick on the market as your potential buyers keep seeing your property on the portals each week.

These buyers will then start to believe there is something wrong with your property and dismiss it even further. That is until you, as the house seller, reduce your asking price. The issue is that sometimes these buyers will think something is wrong with your home and could bid you down even further, meaning you will get less even though you asked for more! (This was backed up by some research done by Which?).

Now according to research by Denton House, the average British house buyer only views around six properties before buying – so please don’t assume viewers will come round your optimistically priced (i.e. overvalued) Coventry home, thinking they will knock you down –  quite the opposite – they just won’t view your home in the first place.

And you know that because I bet you have done the same

yourself when searching for property.

So, all I suggest is this … be realistic with your asking price to start with.

Do that and you will sell your Coventry property at a decent price to a decent buyer … first time, every time – enabling you to move onto the next chapter of your life.

If you know of anyone currently selling their home in the Coventry area and finding things difficult, please share this article with them as it could be of interest.

The Shifting Coventry Property Market

Screenshot 2022-06-17 at 13.39.50 copy
  • The Coventry property market is on the verge of a ‘tipping point’.
  • The rate of house price growth has started to ease with a reduction in the number of properties that will sell in Coventry in the coming 12 to 18 months.
  • Yet, rising interest rates and the cost-of-living issues won’t knock everybody out of the property market and there shouldn’t be a housing bubble for two vital reasons.

 The Coventry property market is on the cusp of a tipping point. It’s a tipping point that will influence Coventry house prices, the number of properties available to buy, demand for those Coventry properties and the lives of every homeowner and the property-owning buy-to-let landlords in Coventry. This shift in the Coventry property market is a big deal so let me explain.

What are the two vital reasons for this shift in the Coventry property market?

First, the easy-going Coventry property market goldmine of the past couple of years will end.

The bonanza of the Coventry property market for house sellers, which was primarily fuelled by cheap money, is receding and the scales are starting to tip somewhat more in favour toward Coventry buyers (which is not a bad thing – more of that later).

Secondly, and more significantly, this shift in the Coventry property market is not a collapse.

Let me enlighten you as to why this is.

One of the key influencing factors of the property market is what people pay on their mortgages. The higher the mortgage interest rate, the higher the mortgage payments.

Mortgage rates are usually 1% to 2% higher than the Bank of England base rate. Therefore, mortgage rates are increasing on the back of higher Bank of England interest rates.

So, whilst we have seen rates rise four times in the last year, the Bank of England base rate stands at only 1%. Compare that with Bank of England base rates in the 1980s (when the average base rate was 12.63%), 1990s (when the average base rate was 8.8%) and the 2000s (when the average base rate was 4.7%). These high base rates (together with high unemployment) contributed to the woes of the UK property market crashes of the early 1990s and 2008.


From the gloomiest economist, the worst-case scenario doesn’t see Bank of England base rates rising past 3%.

This means the prospect of a housing crash is minimal because of the comparatively low unemployment and base rates still at all-time lows.

What are the signs of the shift in the Coventry property market?

 The statistics show a slight shift in the scales between it being a 100% seller’s market for the last two years to more an 80% sellers and 20% buyer’s market and here are the reasons why:-

  1. The number of houses for sale has grown by 17% in six months.

Nationally, the number of properties available to buy has increased by 17.07% in the last six months, rising from 389,558 in January to 456,048 by the end of May. This rise in the number of properties on the market is a crucial component of the housing market puzzle. Let me explain why.

Before Covid, house buyers having more choice of properties to buy in the summer months would have been thought unremarkable. Yet the stark shortage of properties to buy in the last couple of years has caused national house prices to grow by 19.66%. Any growth or reduction in the number of properties for sale is significant (hence a key bellwether).

This means that buyers will have more choice of properties to buy this summer.

  1. The number of properties sold in the UK has dropped 11.4% year to date 2022 vs 2021

When I say sold in this context, I mean the month the house sale price is agreed, and the sold board goes up (not on completion when the keys are handed over).

Looking at the national number of properties sold on a month-by-month basis, things have started to shift since March.

In February 2021, 111,648 houses sold (STC) in the UK compared to 117,734 for the same month in 2022. So almost identical.

Yet, March 2022 saw 15.3% fewer houses sell in the UK than in March 2021 (129,655 in March 2022 compared to 153,023 in March 2021).

April 2022 saw 20.6% fewer houses sold than April 2021 (117,737 compared to 148,228).

So, all doom and gloom? No! Not at all.

The spring months (March and April) of 2021 saw the rush for houses to be sold to beat the Stamp Duty Holiday ending in June 2021, so of course, March and April’s 2022 figures would be lower.

The panic buying of March and April 2021 returned to normal levels in May 2021, meaning the number of houses sold in May 2022 was only 4.3% lower than in 2021 (131,941 in May 2022 vs 137,800 in May 2021).

  1. The number of house price changes has increased by 69% since January.

 In January 2022, the number of house price changes was 27,063 and has been increasing steadily each month to 45,792 in May 2022, an increase of 69%. This means Coventry house sellers have to be more realistic with their pricing to get their properties sold.

Take all these things together and you can see that there are signs that the Coventry property market has started shifting more into buyers’ territory yet is a long way from the traditional idea of a ‘buyer’s market’.

These points can be backed up with the house price data for Coventry.

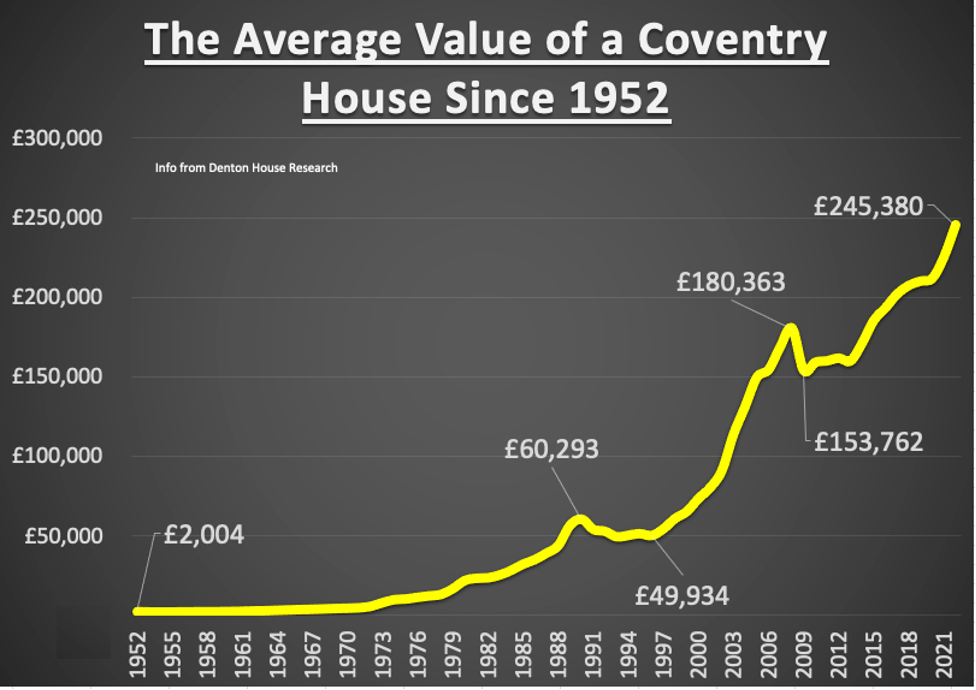
In June 2021, Coventry house prices increased by 1.9% in one month.

Yet last month, for example, Coventry house prices only rose 0.6%, and a few months earlier only rose 1.0%. Not all doom and gloom when you consider…

Coventry house prices are still 9.3% higher than a year ago.

We have been in fifth gear for the last two years with extra rockets attached. We are certainly not going into reverse gear, more a drop down the gears to fourth!

I know many aspiring Coventry homeowners are waiting for house prices to fall, however, I do not foresee any large Coventry house price drops in the next few years. In essence, whilst I do believe the rate of house price growth will slow down, that does not mean it will go into reverse.

Some would ask what increasing interest rates and inflation will do to the Coventry property market?

As I’ve already discussed in several recent articles on my property blog, if interest rates don’t go above 3.5-4%, this will not be a game-changing issue for the Coventry property market. Most homeowners are on a reasonably long-term fixed-rate mortgage (typically 5+ years) and will be able to transfer them across to the new house purchase if they want to move.

Now, of course, that won’t help first-time buyers. I agree there will be fewer Coventry first-time buyers, yet these will be replaced by landlords re-entering the Coventry property market (as I discussed in a previous article a few weeks ago).

Coventry house prices will also be further protected by the effect of inflation on house prices (again discussed in a separate article about a month ago).

As the number of properties coming to market has increased, the choice of properties to buy has expanded. This will encourage those potential cash home buyers who have also been waiting on the sidelines (alongside the landlords) to start viewing and making offers. They, too, have not wished to get into a bidding war but patiently waited for the market to ease.


What Was The Average Coventry House Price in 1952?

Well, what a weekend that was. Street parties, gatherings in the park, the purple bunting, egg and cress sandwiches, union jack flags, cheese and pineapple on cocktail sticks, and let’s not forget the trifle – the Platinum Jubilee Party. And no decent party is worth its salt without a game or a quiz.


So, if you have post-Jubilee blues, let me ask you, how much was the average Coventry house worth in 1952?

To start with, let me look at what a property is worth today in Coventry.

The average price paid for a property in the Coventry area

in the last 12 months was £245,380.


Now, let’s go back to 1952. Sir Winston Churchill was the Prime Minister, Newcastle won the FA Cup, London was covered in the Great Smog, free prescriptions on the NHS ended (it cost 1 shilling or 5p in new money), and King George IV, at the age of 56 passed away on the 6th February, meaning Princess Elizabeth became the Queen – as for housing …

The average price of a Coventry home in 1952 was £2,004.

This means Coventry house prices are 121 times higher since 1952.

Yet over the last 70 years, the country has been subjected to 4.5% per annum inflation.

The 1952 Coventry home is equivalent to £38,530 today

when adjusted for inflation.


This means Coventry house prices have increased by 504.8% in real terms since 1952.


So, does that mean house prices are more expensive today compared to 1952?


In 1952, the average annual male wage was £452, 8 shillings and 1 pence, meaning the average Coventry house was 4.43 times the average value of a wage. Today the average home is 8.85 times the average wage.

Yet let us not forget the average mortgage payment in 1952 was £11 per month. The average Brit earned £34 per month, meaning 32.3% of the household income was going on mortgage payments, whilst nationally today, according to the Nationwide, it stands at 28%.

It’s cheaper, in real terms, to buy a property in 2022 than in 1952.

And that’s the point, something things in ‘real terms’ (real terms being true spending power of the money after taking into account wages, costs and inflation) were more expensive and some cheaper 70 years ago. For example, in 1952, petrol was equivalent (in today’s inflation-adjusted prices) to £1.02 per litre, a pint of beer £2, half a dozen eggs £2.20, cheddar cheese £2.40 per 500g, a basic radio £430, a Hoover £530 and a 12-inch TV £1,600.

So back to property, the Queen’s reign has seen some amazing house price rises in the UK, yet that growth hasn’t always been in a constant upward direction, as we have had a couple of dips along the way.

Picture 1

We had a house price crash in 1990, when the average value of a Coventry property dropped from £60,293 to £49,934 in 1996, only for them to start rising again.

Coventry saw another house price crash between 2008 and 2009, and the average house price dropped from £180,363 to £153,762 in a year.

So, what else has changed about property and housing since the Queen came onto the throne?

In 1952, only 32% of people owned their own home, whilst 50% of people rented from a private landlord and 18% rented a council house.

By the time of the Silver Jubilee in 1977, 56% of people owned their own home, with 12% of people privately renting and 32% rented from the council.

Come the Golden Jubilee in 2002, 70% of people owned their own home, with 11% of people privately renting and 19% rented from the council.

Today, 63% of people own their own home, 20% of people

privately rent and 17% rent from the council.


So to conclude, as we look forward into the 21st century, I am sure the property market will be totally different again in 70 years.


I hope you enjoyed reading this article and do share it with your friends if you find it interesting.


P.S. for all you Rightmove fans, the average Coventry terraced home in 1952 was worth £1,592, and a semi in Coventry could be bought for, on average, £2,060.


The Cost of Trading Up in a Rising Market

House prices have been significantly on the rise in the last couple of years. In some parts of Warwickshire prices have risen around 30% during the pandemic, defying all of the doom mongers’ predictions when Covid first struck. iStock_000002696243XSmall

But what do these big price changes mean for you as a homeowner? Do you check your property value on a regular basis or have sleepless nights about it?

Hopefully not. However, if you decide to move home then the price increases will undoubtedly have an impact on your moving decisions at that point. If you need to downsize then congratulations. You will be able to cash in on your property’s increase in value and should be able to comfortably purchase a smaller home and walk away with a tidy margin at the end of the process.

But what if you are upsizing or perhaps you are a first time buyer? For sure, first time buyers will have lost out. They will need to have a bigger deposit saved up, trying to save as fast as the market is rising is a tough ask.

For the large numbers of growing families who need to upsize, price increases are also not such good news. It may feel good to look at the latest Zoopla Index and see your property value grow, but if the larger property that you desire down the road is going up in value at the same percentage rate then it is getting further and further out of reach as time goes by.

With high demand and low stock levels remaining as the 2 big underlying fundamentals to market demand, upward pressure on prices is likely to remain in place for the foreseeable future. In other words the longer you hold off on that upsize, the tougher it will be to finance when you do decide to take the plunge, so right now, the wait and see approach is costing you money!

Book a valuation today and get the ball rolling on your next home move. Speak to one of our experts, we’ll be delighted to help!

Landlords – Are you ready for tighter regulation?

Just as you thought it was safe and the government couldn’t bring in any further red tape for Landlords, think again!Red-Tape

With ever increasing regulation, the burden on buy to let property investors seems to be never ending and increasingly arduous. Are you a Landlord worried by regulation and concerned whether your property will shape up in the coming months and years?

One major piece of legislation that looms on the horizon is the minimum EPC requirements for all privately rented residential property. Currently a property must have an Energy rating of A-E. However the government is proposing to change this to A-C by 2025. This would represent a major shift and leave a large proportion of the current rented stock and landlords out in the cold and unable to let their properties, in just 3 years time.

To put this requirement into perspective, some new build properties are only scoring a Grade C so if you have a Victorian or Edwardian property, the task of bringing this up to a C in order to comply with the regulations is considerable, and in many instances will be impossible or simply not viable.

There will be exemptions to the rules of course. Listed properties will not need to comply and if you can prove that the work is not ‘financially viable’ then you may also be exempt, but this will not be an easy thing to prove.

It is conceivable that government will back down on this between now and 2025, however this is a major part of their strategy towards net zero and without schemes like this working, they have little chance of meeting those goals, so it would seem that there may be some small concessions but tighter regulation is definitely coming and now is the time to start preparing if you are (or want to be) a landlord.

For further information on the current landlord responsibilities and future legislation speak to our Lettings Manager Carol, who will be delighted to assist.

PROPERTY PRICES SET TO RISE IN 2022

Just 2 weeks into the new year and a pattern is already emerging for the year ahead. Rightmove have just reported the busiest start to the year ever in terms of new enquiries, yet at the same time reported the lowest stock levels ever.

For those of us who did GCSE Economics, one thinks of the Demand vs Supply graph and the inevitable move up the graph this leads to in terms of price. For those of you who were lucky enough to avoid studying Economics at school then simply picture a shop full of eager buyers and just a few items left on the shelf, the inevitable rush this would create and the shop owner effectively being able to ‘name her price’. It’s not rocket science.Board Images

The current shortage of property for sale seems to be exacerbating the problem, with some homeowners (who need to move) scared to go on sale for fear of not being able to find somewhere to move to. Understandable but not logical.

February, March and April are traditionally the 3 busiest months of the year for the sale market, and the signs are there that new stock will be coming available very soon. All 3 of our branches are currently busy with valuations and the pipeline of new property is building up.

Do you need or want to move in 2022? If so the best properties will likely be coming to market over the next few weeks. Will you be ready and able to pounce when the RIGHT property becomes available or will you miss out yet again because your own home wasn’t sold or wasn’t even on sale?

Elizabeth Davenport can offer you a no sale/no fee option so if you market with us there is no risk of being out of pocket. If you can’t find somewhere suitable to move to then you simply stay put and there’s no charge. Invite our expert valuer to visit your home today and get free advice on your property value and the current market conditions. We’d love to help.